Article
The Art of CRM Dashboards: What Every Business Should Measure
SmallBizCRM Staff – September 4th, 2025
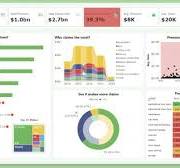
Business environments are data-drive! The sheer volume of information can be overwhelming. A well-designed CRM dashboard serves as a compass, guiding teams through the noise toward the insights that matter. From sales performance to customer satisfaction, dashboards provide a real-time snapshot of business health and empower decision-makers with actionable information. But creating an effective CRM dashboard isn’t simply about visual appeal—it’s about measuring the right things, presenting them clearly, and ensuring they drive decisions that impact success metrics.
Why CRM Dashboards Are Essential
 A CRM dashboard consolidates key information from your customer relationship management system into a single, visual interface. This enables teams to:
-
Monitor Performance: Track sales pipelines, marketing campaigns, and service tickets in real time.
-
Identify Trends: Quickly spot patterns that could indicate opportunities or risks.
-
Drive Accountability: Assign ownership of metrics to specific teams or individuals.
-
Enhance Decision-Making: Provide insights that inform strategies across marketing, sales, and customer service.
Without a well-structured dashboard, data remains buried in reports, spreadsheets, and emails—making it difficult for leaders to act decisively.
Key Metrics Every Business Should Track
While every business is unique, there are core metrics that provide meaningful insight across industries:
1. Sales Metrics:
-
Lead Conversion Rate: Measures how effectively leads turn into paying customers.
-
Pipeline Value: Monitors the total potential revenue in your sales pipeline.
-
Win/Loss Rate: Identifies which deals are successful and which require attention.
2. Customer Metrics:
-
Customer Satisfaction (CSAT): Provides feedback on the quality of service or product experience.
-
Customer Retention Rate: Shows how well your business retains clients over time.
-
Net Promoter Score (NPS): Measures likelihood of customers recommending your brand.
3. Marketing Metrics:
-
Campaign ROI: Evaluates the effectiveness of marketing initiatives.
-
Lead Source Performance: Reveals which channels generate the highest-quality leads.
-
Email Engagement: Tracks open rates, click-throughs, and conversions from campaigns.
4. Service Metrics:
-
Response Time: Measures how quickly customer queries are handled.
-
Ticket Resolution Rate: Tracks efficiency in closing customer issues.
-
Customer Feedback: Monitors satisfaction trends in support interactions.
By integrating these metrics into dashboards, businesses can align teams toward common objectives and uncover opportunities for growth.
Tips for Building Insightful CRM Dashboards

Creating dashboards that truly inform requires more than selecting a few KPIs. Here are actionable tips for building dashboards that drive success:
1. Focus on Actionable Metrics:
Prioritize metrics that can influence decisions. Vanity metrics like raw page views or social likes may be interesting but rarely drive meaningful business outcomes.
2. Keep It Simple:
Too much information can overwhelm users. Use a clean layout, group related metrics, and avoid clutter. Visual cues like color coding, progress bars, and trend lines can make data easier to interpret.
3. Tailor Dashboards to Roles:
Different teams need different insights. Sales teams may focus on lead pipelines, while marketing teams monitor campaign performance. Customize dashboards so each user sees metrics relevant to their role.
4. Set Clear Targets and Benchmarks:
Metrics are most useful when compared against goals. Include target lines, historical comparisons, or industry benchmarks to contextualize data.
5. Use Real-Time Data:
Outdated information can mislead decisions. Integrate dashboards with live CRM data to provide up-to-the-minute insights.
6. Combine Quantitative and Qualitative Data:
Numbers tell a story, but customer feedback adds depth. Including qualitative insights such as survey responses can help teams understand the “why” behind trends.
7. Enable Drill-Down Capabilities:
High-level metrics are important, but the ability to drill down into underlying data allows for root-cause analysis. For instance, if lead conversion drops, drill down to see which source or sales rep is affected.
8. Review and Refine Regularly:
Dashboards aren’t static. As business goals evolve, so should your metrics. Schedule periodic reviews to ensure dashboards remain relevant and actionable.
The Benefits of Well-Designed Dashboards
When implemented effectively, dashboards transform CRM data from raw numbers into strategic insights. Businesses can:
-
Make Faster Decisions: Quickly respond to shifts in the market or customer behavior.
-
Improve Forecast Accuracy: Monitor trends and pipeline health to predict revenue more reliably.
-
Boost Team Performance: Visibility into KPIs encourages accountability and goal alignment.
-
Enhance Customer Experience: Track service metrics to resolve issues faster and improve satisfaction.
A CRM dashboard is not just a reporting tool—it’s a strategic ally, helping businesses measure success and continuously improve performance.
Conclusion
The art of CRM dashboards lies in measuring what truly matters. By focusing on actionable metrics, presenting them clearly, and regularly refining dashboards to match evolving business needs, organizations can unlock the full potential of their CRM data. Whether you’re tracking sales pipelines, customer satisfaction, or marketing ROI, a well-crafted dashboard provides the insights necessary to make confident, informed decisions—and ultimately drive business success.